.jpg)
Weekly blog by Liberty and Liam
Data and Graphs
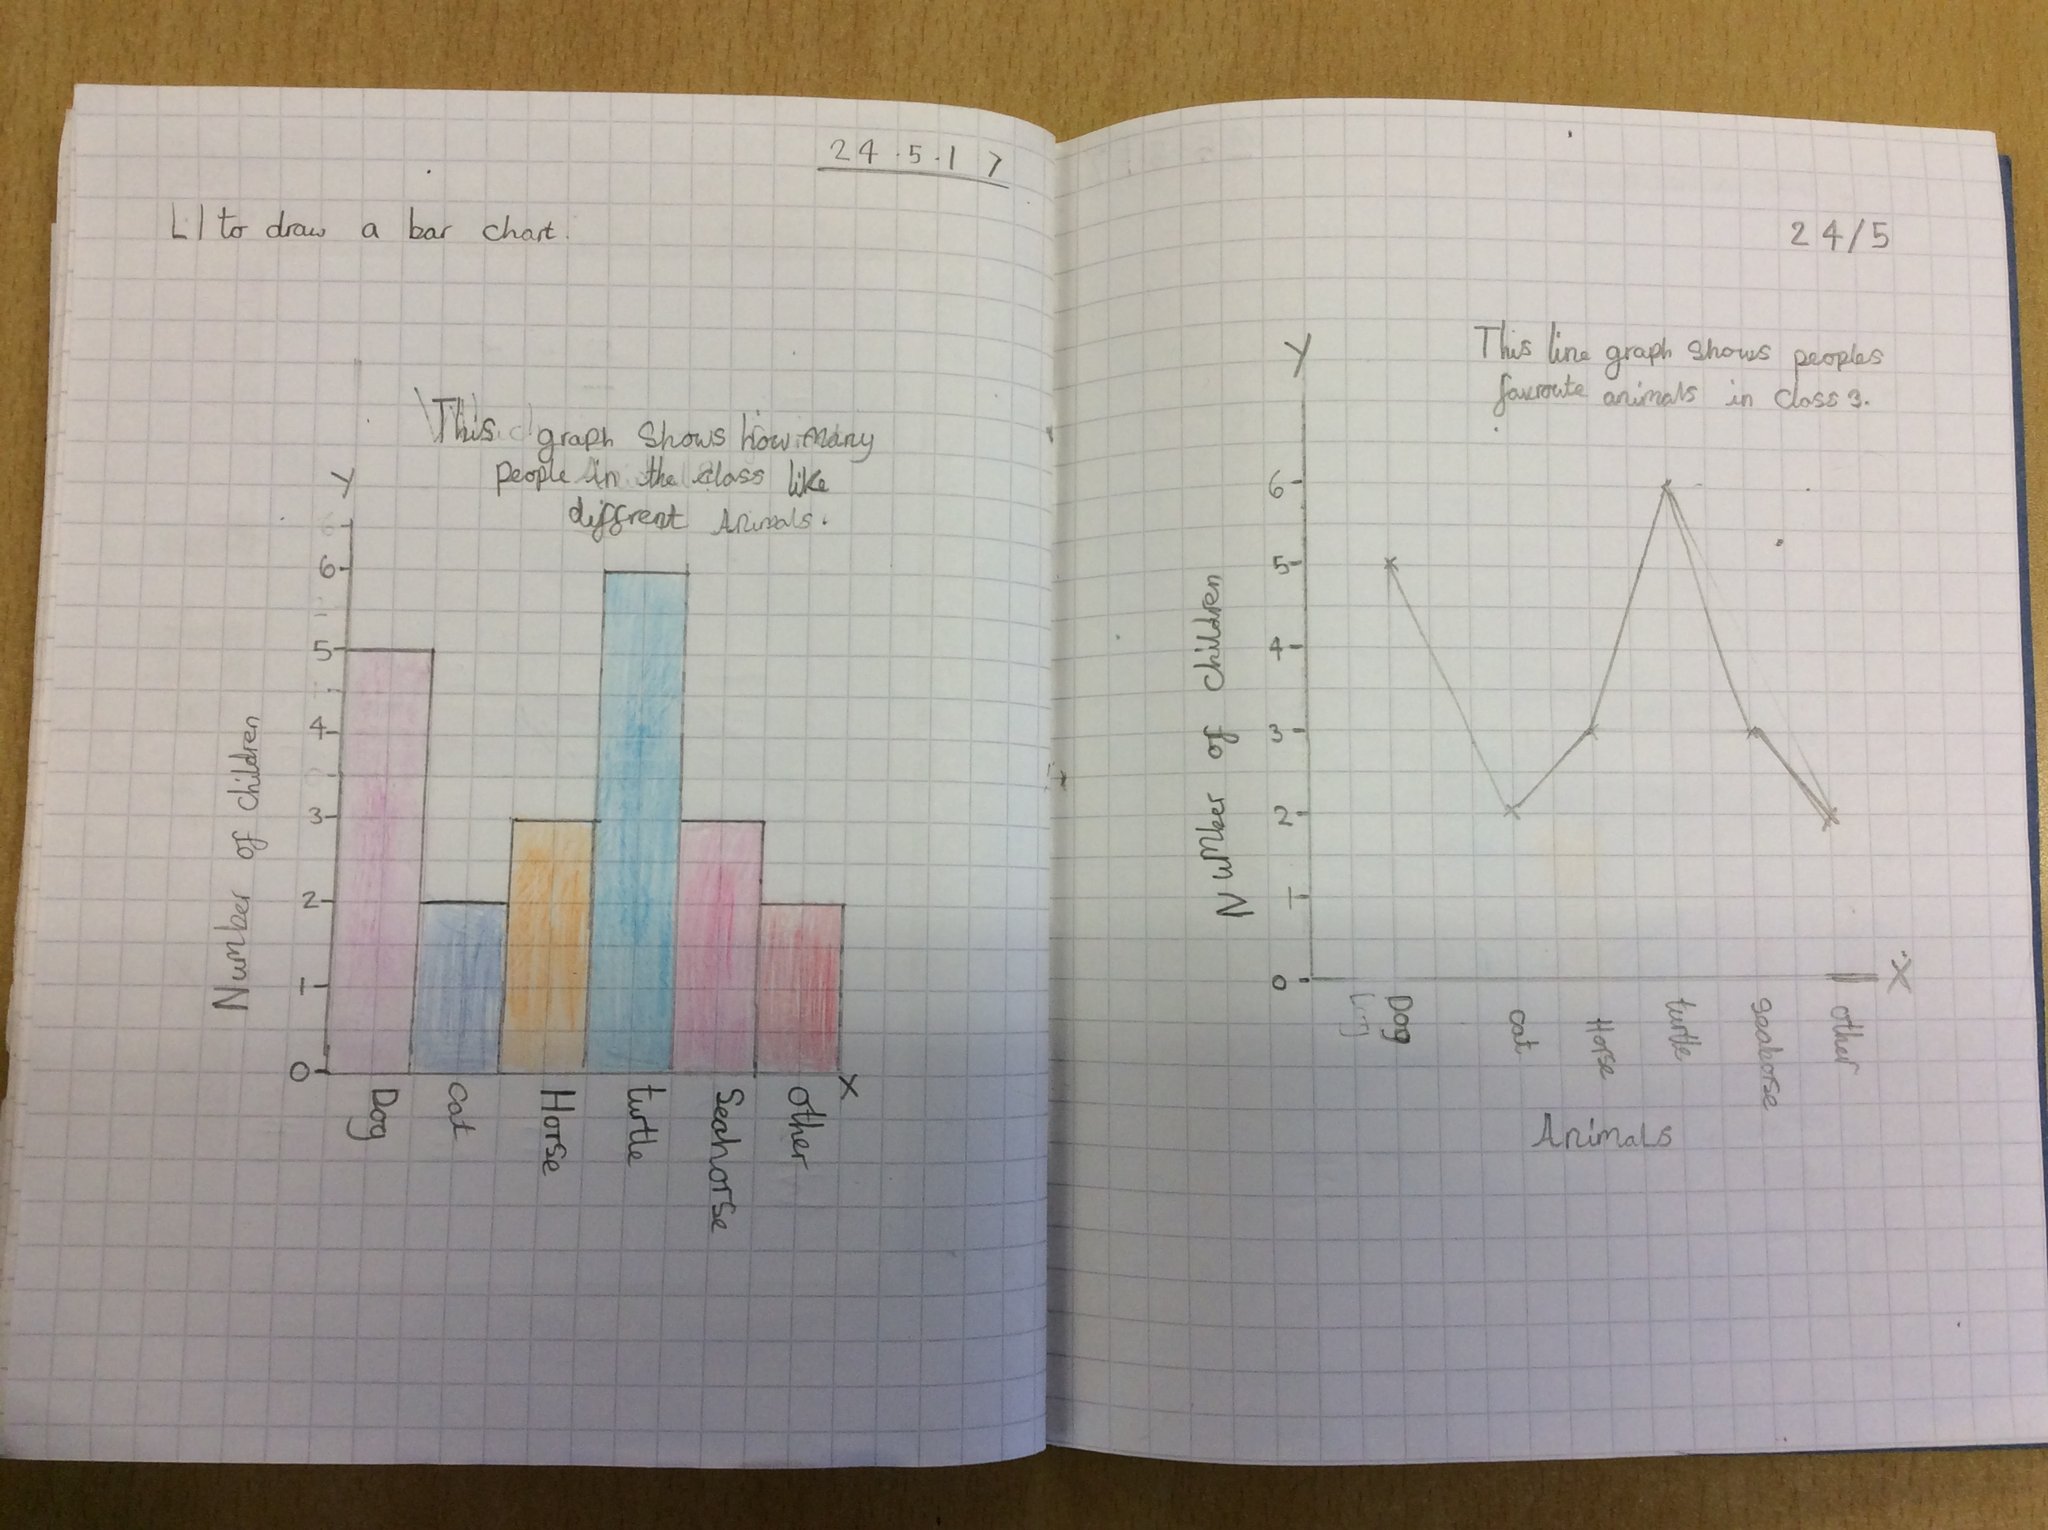
In maths this week, we have been working on data handling. There are many ways to show data. We have drawn
- bar charts
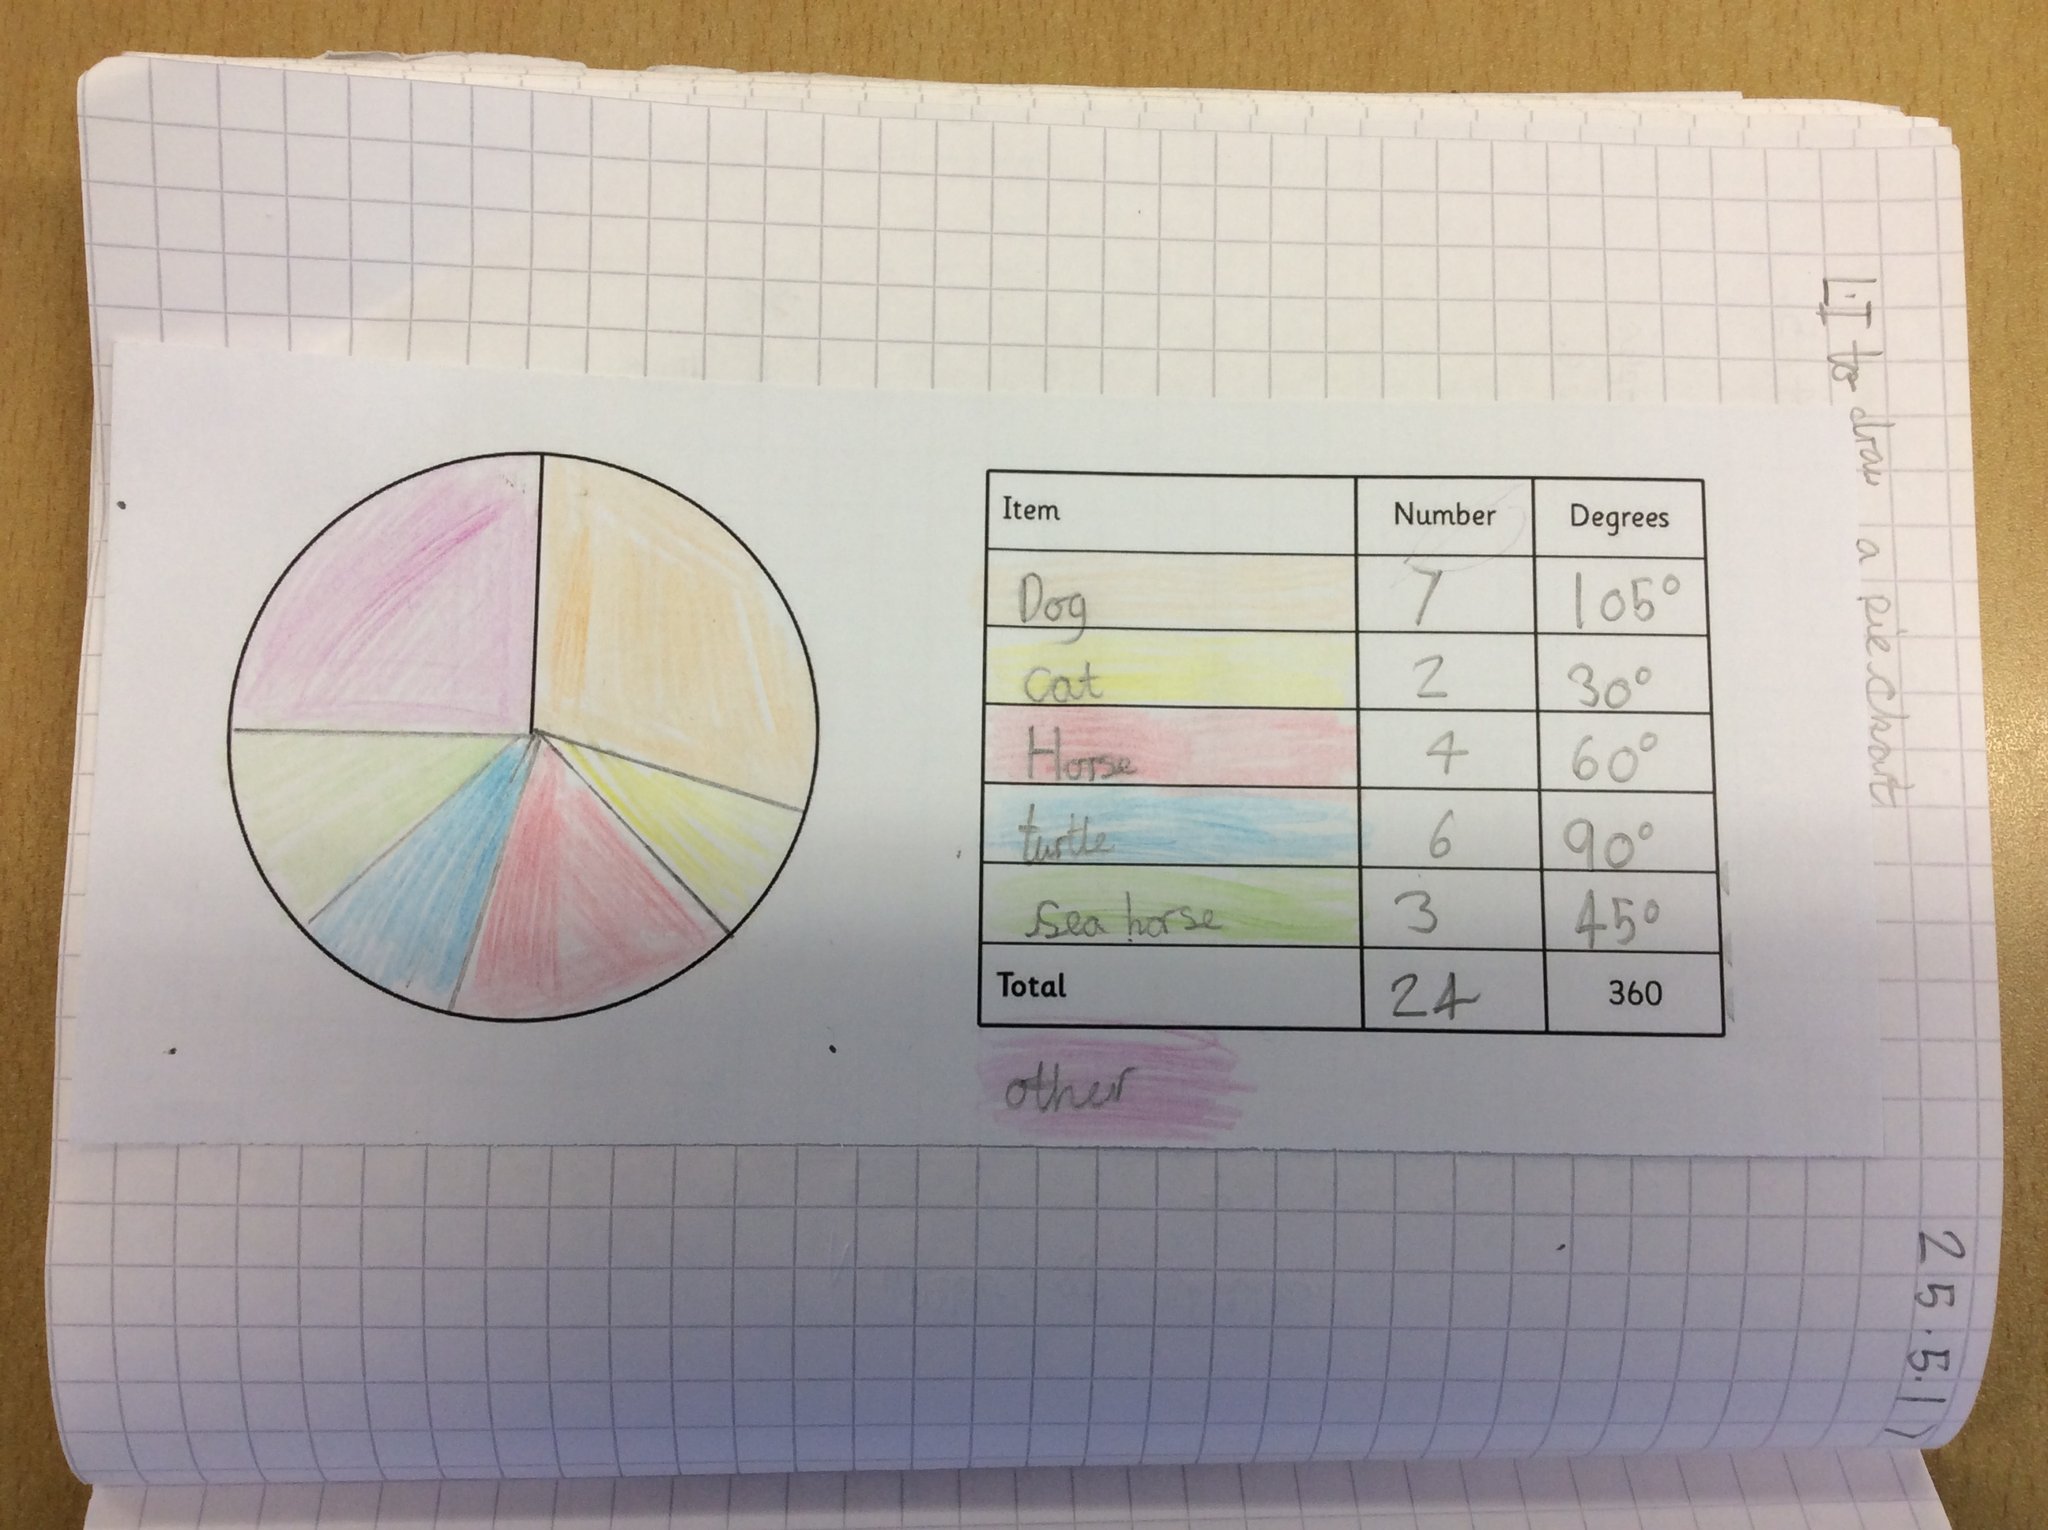
- pie charts
- line graphs
- pictograms
- time graphs
First we decided what data to collect Liberty asked the class what their favourite animal was. They had a choice of
- dog
- cat
- horse
- turtle
- sea horse
- other
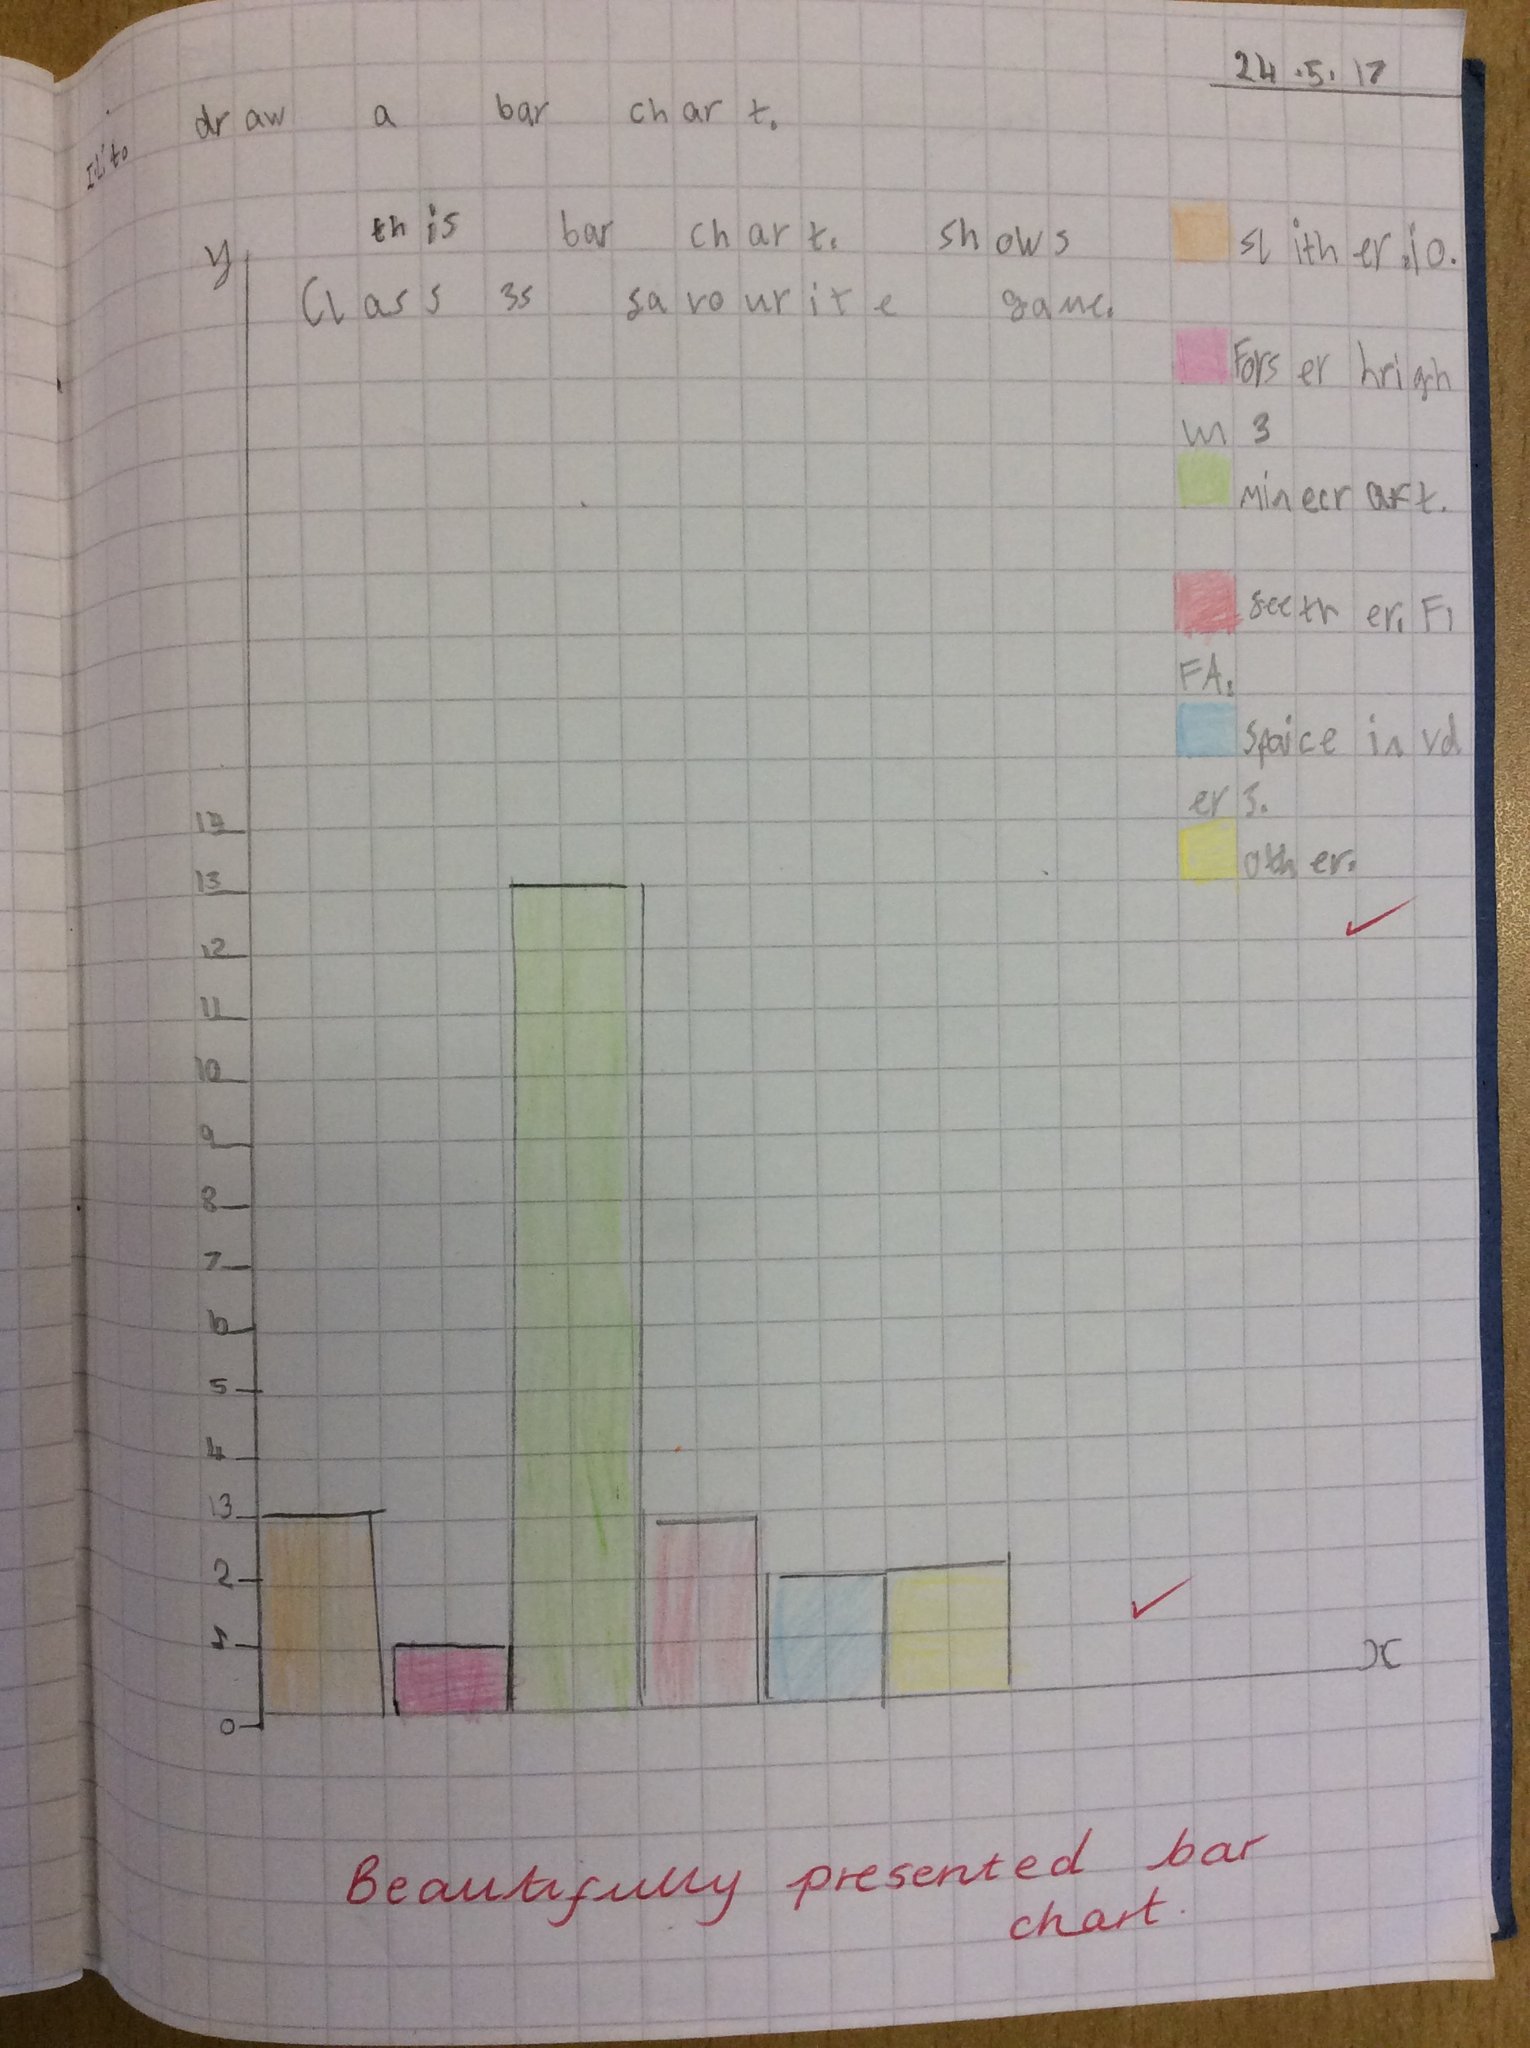
Liam asked the class what their favourite video game was, they had a choice of
- sliterio
- forza horizon 3
- minecraft
- Fifa
- space invaders
- other
To draw a bar chart you need
- y axis
- x axis
- scale
- colour coded key
- title
- bars/data
Our favourite parts of the week:
Liberty: My favourite part was collecting data for everyones favourite animal and presenting it on a bar chart.
Liam: My favourite part was reading the questions on pictograms.


.JPG)
.JPG)
Take a closer look at our photos in our photo gallery!


.JPG)
.jpg)
